
By Stephanie Johnson
Published October 2026
September is when San Francisco gets back to business. Kids are back in school, Labor Day is behind us, and the fall listings start coming quickly. This year that wave of new inventory did arrive, and buyers met it head on, pushing prices higher and closing faster than they did in August.
The Big Picture: August Was a Pause, Not a Turn
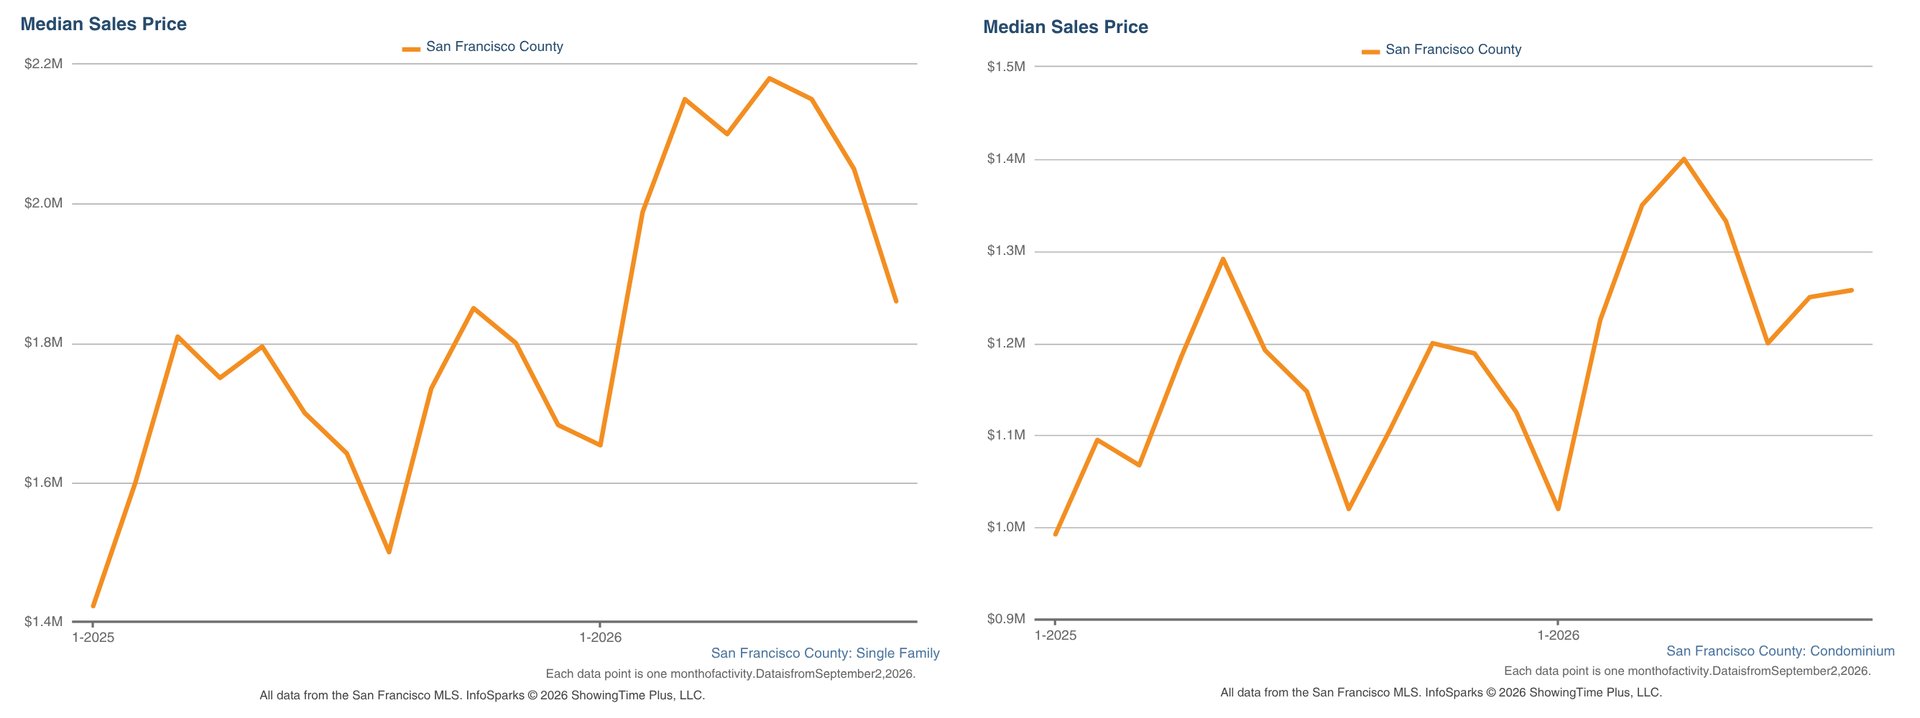
The median single family home sold for $2,058,000 in September, up from August's $1,860,000 and 18.6% above the $1,735,000 median from September 2025. Prices are still a bit short of the spring high near $2.2 million, but last month's dip now looks like a breather rather than the start of a slide.
Condos kept climbing. The median condo price rose to $1,325,000, up from August's $1,257,500 and 19.6% above last September's $1,107,500. That's the third straight monthly gain for condos and the highest prices since spring. It's also worth noticing that condo prices are now growing slightly faster year over year than single family homes, a sign that buyers priced out of houses are competing hard for the next best thing.
Inventory: The Fall Listings Finally Show Up
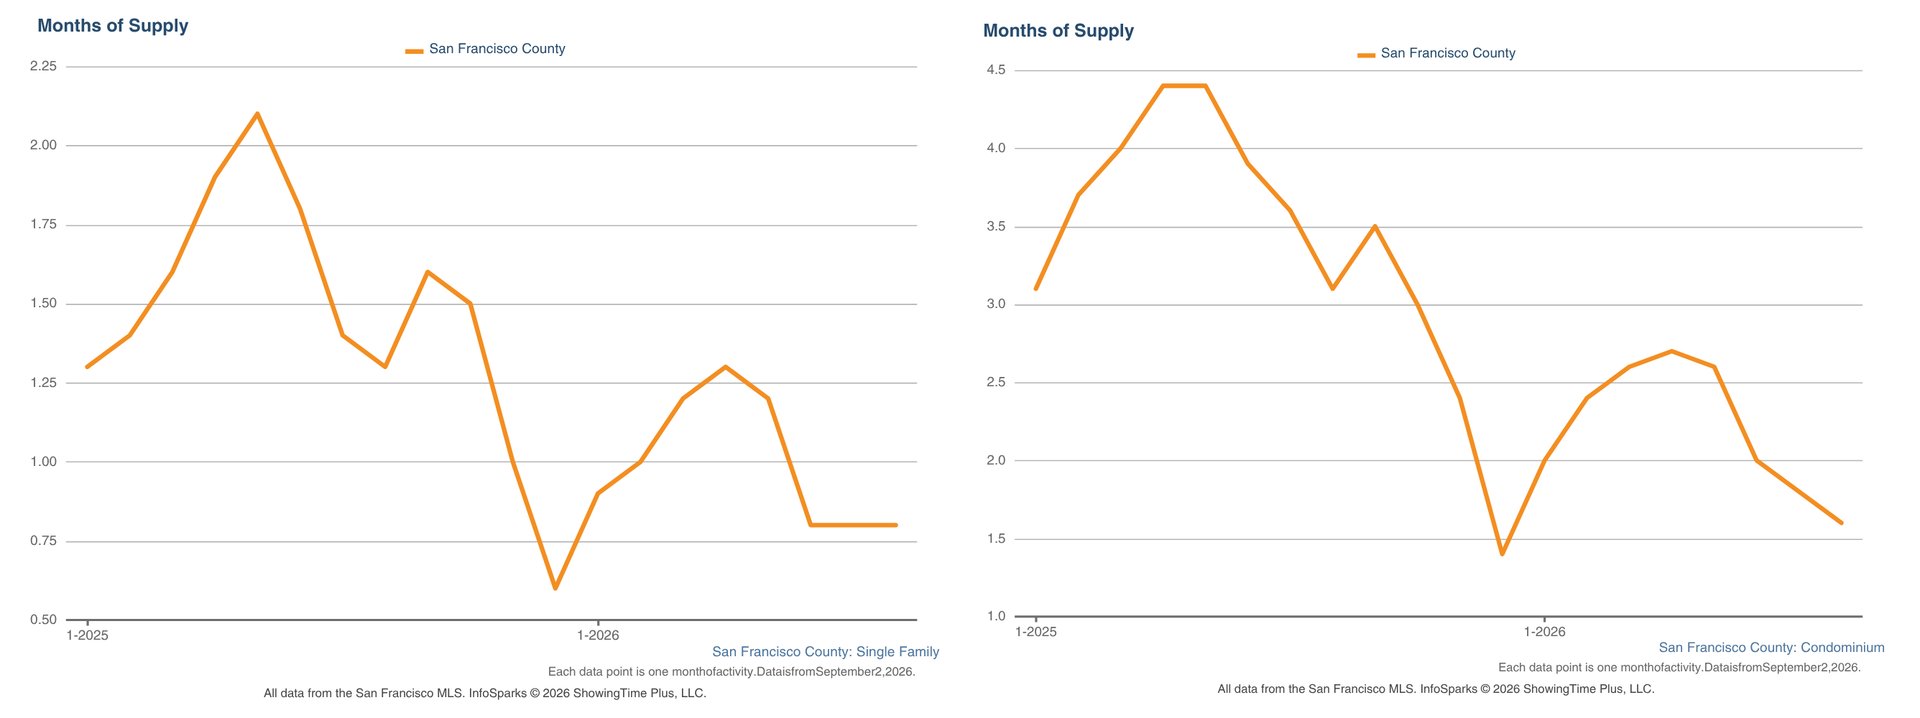
Single family months of supply rose to 1.2 from 0.8 in August, a 50% jump and the first meaningful inventory bump we've seen since spring. Condo supply moved in the same direction, climbing to 2.0 months from 1.6.
Despite the trend, single family supply is still 25% below last September's 1.6 months, and condo supply is down about 43% from 3.5 months just a year ago. Buyers have more to look at than they did a month ago, but by any normal measure this is still a strong sellers' market.
Days on Market: More Homes, Faster Sales
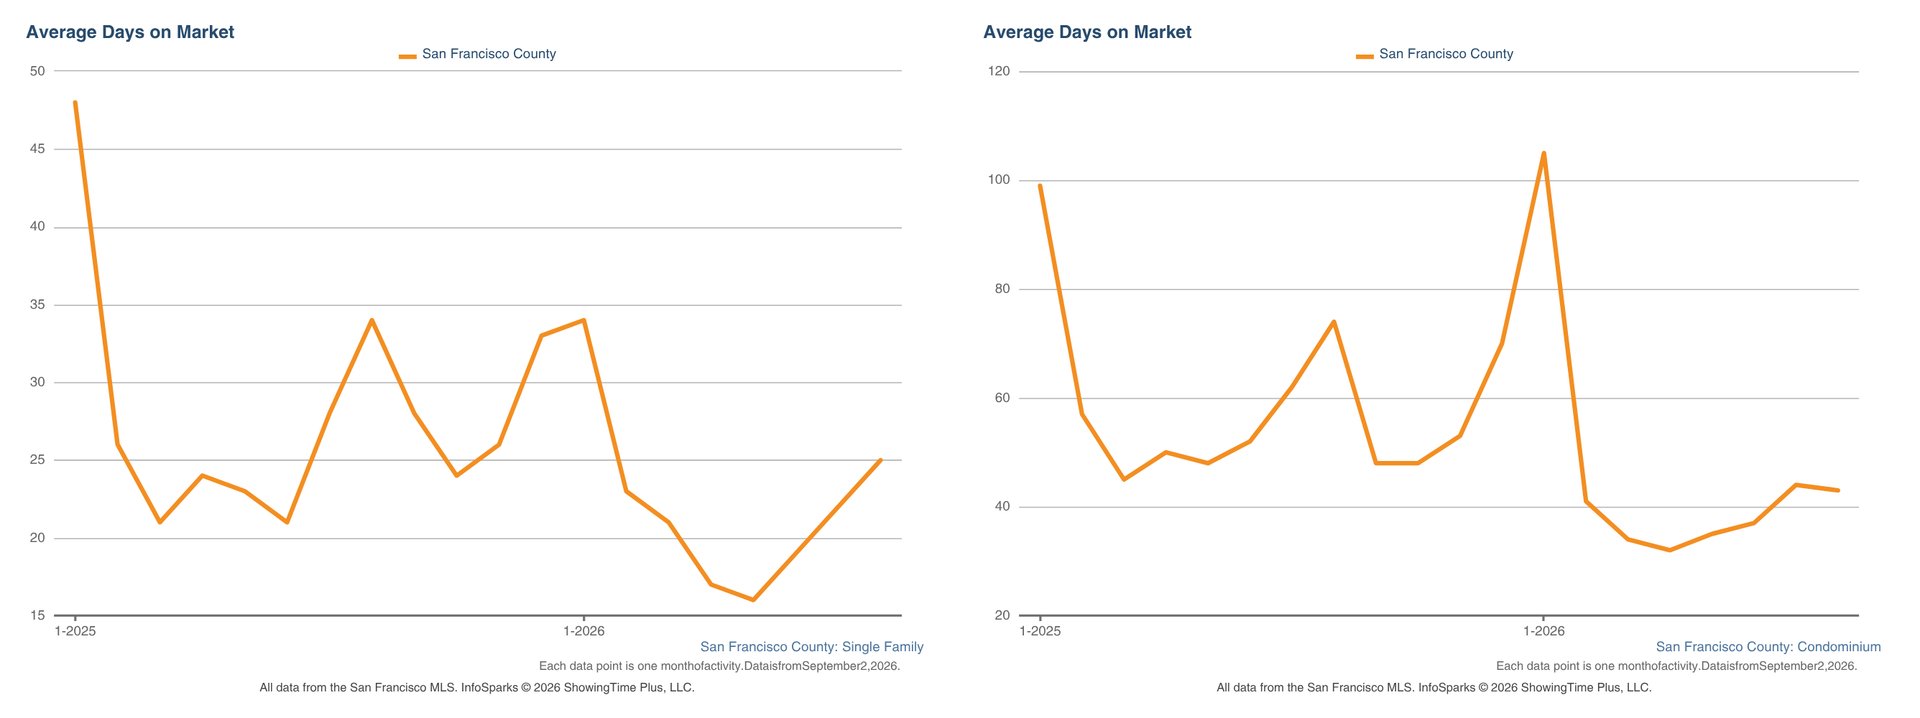
Here's the surprise. You'd expect extra inventory to slow things down, but homes actually sold faster in September. Single family listings averaged 22 days on market, down from 25 in August and 28 last September, about 21% quicker than a year ago.
Condo sales sped up too, averaging 38 days versus 43 in August and 48 last September. More choice didn't make buyers more patient. If anything, the new listings gave buyers who'd been waiting all summer for something to buy, the motivation to step up and act.
Price Per Square Foot: New Highs in Both Segments
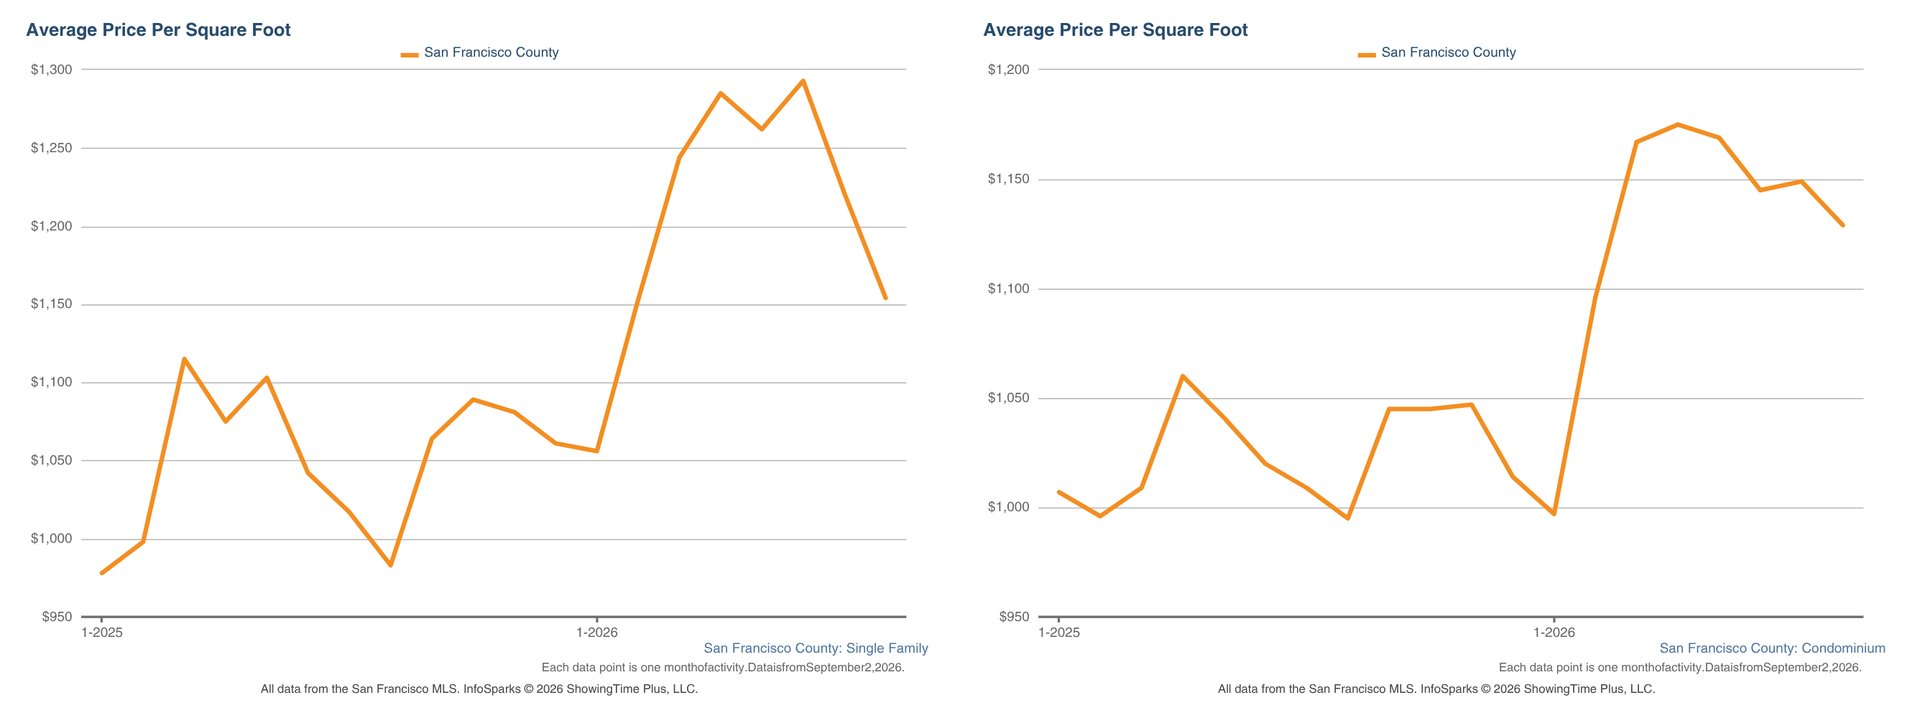
Single family homes averaged $1,313 per square foot in September, up 13.8% from August's $1,154 and 23.4% above last September's $1,064. That's the highest monthly figure since at least the start of 2025. Condos reached $1,189 per square foot, up 5.3% from $1,129 in August and 13.8% from $1,045 a year ago, also a high for that same stretch.
One caveat: a one-month price jump of this size partly reflects which homes happened to close (a few large, renovated houses can tilt the average). The year-over-year number is the more reliable read, and it says buyers are paying meaningfully more per foot than they were a year ago.
How This September Compares to Seasonal Trends
September usually kicks off San Francisco's second selling season. Sellers who sat out the summer list after Labor Day, and buyers come back with fresh focus. Part of that played out right on schedule. Part of it didn't.
What aligns with seasonal trends
Inventory loosened after Labor Day, with months of supply rising in both single family homes and condos.
Buyer activity picked back up after the late-summer lull, and the pace of sales quickened.
What stands out this year
Prices rose right alongside the new supply. Normally extra listings give buyers some leverage, but this September the homes that are selling are moving faster than ever.
Even after the bump in inventory, single family supply (1.2 months) and condo supply (2.0 months) remain well below where they were a year ago.
Condos are no longer lagging. Their year-over-year price growth slightly outpaced single family homes this month.
Seller Takeaways
You have more competition. Single family supply rose to 1.2 months from 0.8, so buyers are comparing your home against more options than they were in August.
Buyers are still paying big prices for homes that meet their needs. The median house price is back above $2 million and price per square foot hit a new high, so August's softer numbers shouldn't anchor your pricing.
Condo sellers are in their best position in over a year, with three straight months of median price gains and homes selling in 38 days versus 48 last September.
With more listings to choose from, preparation and accurate pricing matter more now than they did over the summer.
Buyer Takeaways
There's more to choose from than at any point since spring, but 1.2 months of single family supply is still a sellers' market.
More inventory hasn't bought you more time. Houses averaged 22 days on market and condos 38, both faster than August, so be ready to act once you find the right fit.
Condos aren't the bargain alternative they were a year ago. Median condo prices are up 19.6% year over year, slightly ahead of single family homes.
Monthly price per square foot can swing with the mix of homes that close, so lean on recent comps from the specific neighborhood you're shopping in.
Looking Ahead
The big question for October is whether inventory keeps building. And if we see more homes hit the market, will they continue to be met with the same intense buyer demand we have witnessed? We are already seeing fewer offers on homes than a few months ago, which could be the effect of rising interest rates. If prices are affected, the October data should bear that out.
Condos are the segment to watch. The condo market has spent the last several months firming up as single family prices have been pushed up and out of reach for some buyers. Will interest rate increases cool this trend?
With the holiday slowdown typically arriving by mid November, the next six weeks are crucial for both segments.
Work With Us
For more information on the San Francisco market, or for data specific to your neighborhood or property type, reach out to the RealWise Properties team and book a call. We're here to help you navigate it.