
By Stephanie Johnson, Your Sonoma County Real Estate Authority
Published February 3, 2026
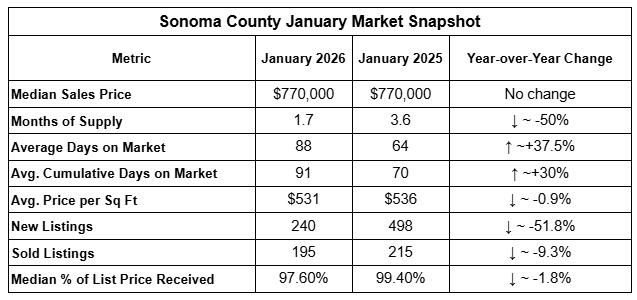
January is typically a slower, reset month for the Sonoma County housing market. This year’s data follows familiar seasonal patterns, but with one defining difference: inventory is dramatically tighter than last January, even as pricing remains stable and homes take longer to sell.
Below is a clear year-over-year comparison to help frame the story.
The Big Picture: Stable Prices, Scarce Inventory
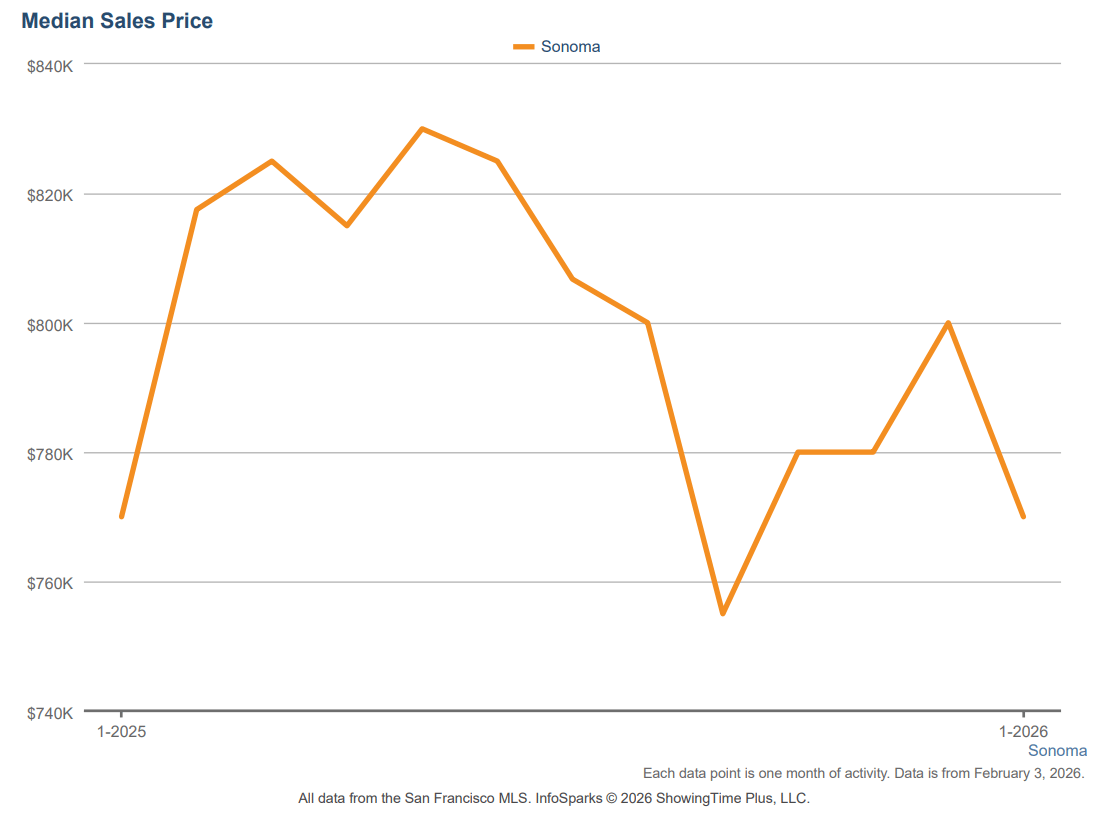
The median sales price held steady at $770,000, unchanged from last January. This reflects a market where sellers are largely maintaining price expectations despite slower activity.
Historically, January pricing in Sonoma County tends to flatten due to lower transaction volume rather than declining demand. This year fits that pattern closely. The stability suggests sellers are opting to wait rather than discount, while buyers remain selective.
Sonoma County Median Sales Price Trend - January
Inventory: The Defining Story This January
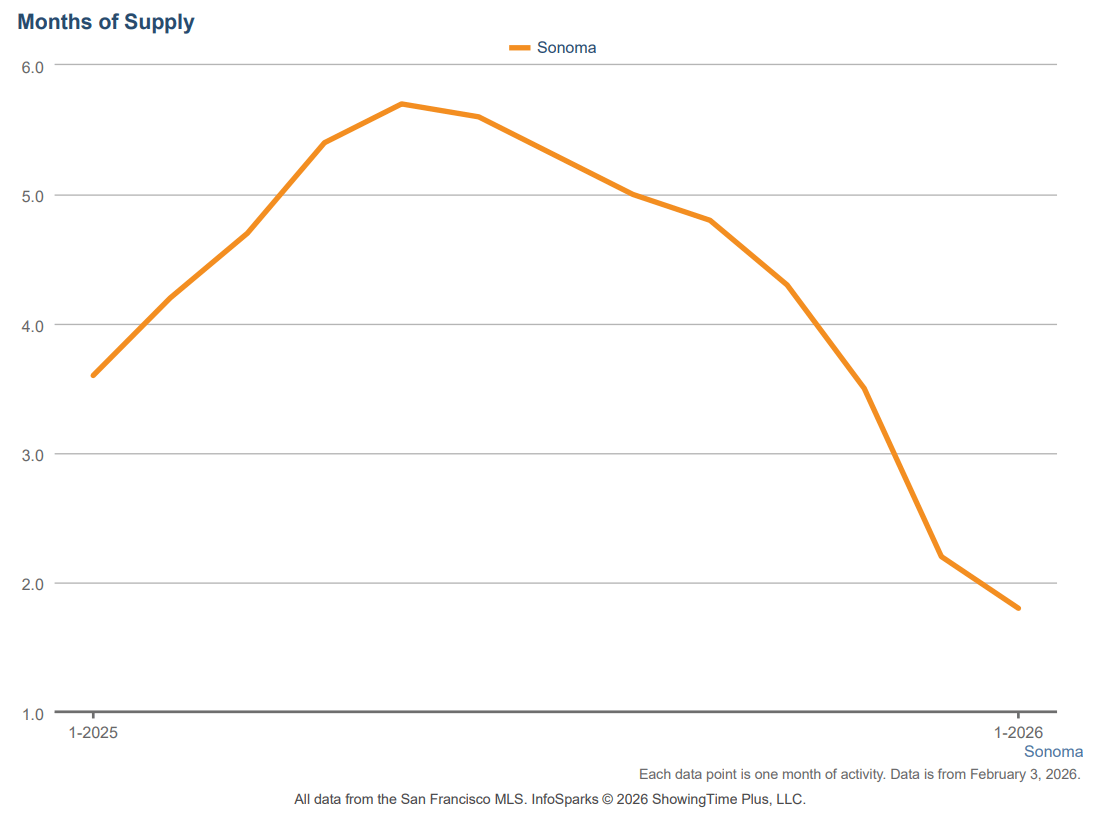
At 1.7 months of supply, inventory is less than half of what it was one year ago. January is typically a month when inventory rebuilds slightly — but this year, the opposite occurred.
New listings fell more than 50% year-over-year, signaling that many potential sellers are holding off, likely waiting for spring conditions or improved confidence.
When January begins this tight, it often sets the stage for:
-
Faster absorption as demand returns
-
Increased competition later in the spring
-
Less negotiating leverage once activity accelerates
Sonoma County Months of Supply Trend - January
Days on Market: Seasonal Slowdown, Not Weak Demand
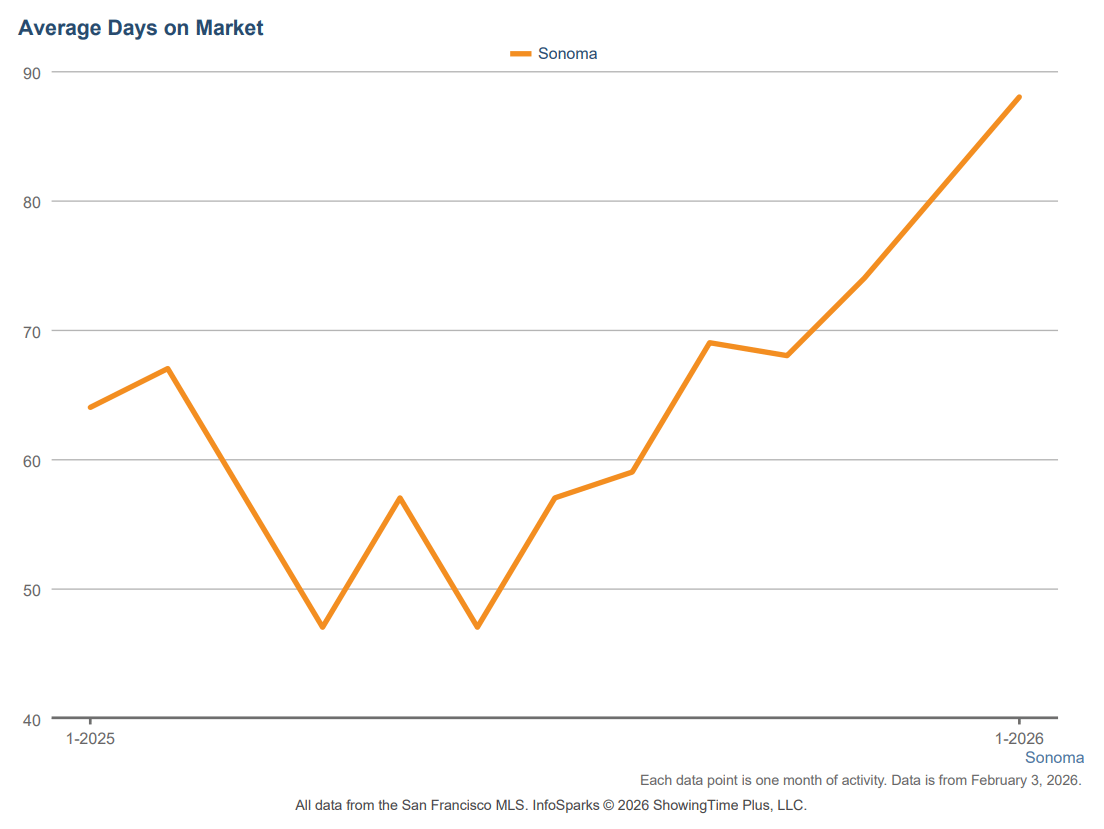
Homes took longer to sell this January, with average days on market rising to 88 days. This is typical for winter months, when buyers are more deliberate and urgency is lower.
The increase in cumulative days on market reinforces that homes are not rushing off the market — but they are still selling. This pattern is consistent with buyers negotiating more carefully rather than stepping away altogether.
Sonoma County Avg. Days on Market Trend - January
Price Per Square Foot: Holding Steady
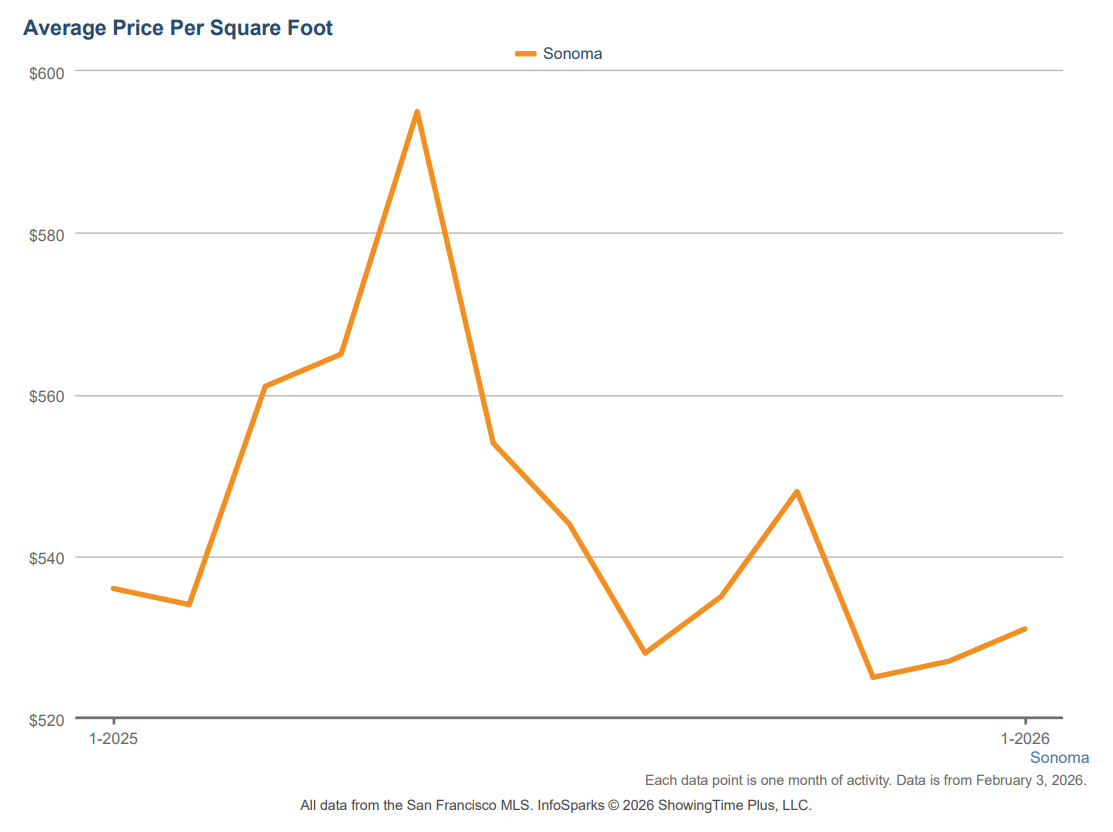
The average price per square foot dipped slightly, down less than 1% year-over-year. This metric tends to be more stable than median price and continues to suggest that underlying values remain intact, particularly for well-located and well-presented homes.
Sonoma County Avg. Price Per Sq Ft Trend - January
How This January Compares to Historical January Trends
January 2026 aligns closely with long-term seasonal behavior in Sonoma County:
-
Pricing remains flat
-
Days on market are elevated
-
Buyer activity is measured
What stands out is just how limited supply is, even by winter standards. That structural tightness continues to support pricing and will matter as demand increases later in the year.
Seller Takeaways
-
Inventory is exceptionally low for this time of year
-
Prices are holding, despite longer selling timelines
-
Well-prepared homes remain competitive
Sellers who prepare early and enter the market ahead of spring inventory may face less listing competition than those who wait.
Buyer Takeaways
-
Slower pace allows more time for due diligence
-
Negotiation is occurring, though modestly
-
Inventory remains limited, even with fewer buyers active
Buyers waiting for more options may face increased competition once seasonal demand returns.
Looking Ahead
January doesn’t define the year — but it reveals its starting position.
Sonoma County enters 2026 with stable pricing, elevated days on market, and historically low inventory. If new listings fail to rebound as demand increases, market conditions could shift quickly as we move toward spring.
For now, the market appears calm on the surface — and constrained underneath.
If you'd like to discuss how these trends apply to your specific real estate goals, book a call with me. I'm always here to help.
Email: [email protected]
Phone: (415) 217-9479
Copyright © 2026 Stephanie Johnson. All rights reserved.